(STACKER) – From 2018 to 2019, the U.S. population grew by 0.48%, its slowest rate in 100 years. Declining births, increasing deaths largely due to the graying Baby Boomer population, and a crackdown on immigration have contributed to many states seeing net population losses in recent years.
But in other pockets of the country, populations are growing. These shifts can be due to job opportunities, high quality of life, easy commutability to job centers, low rents, or any combination of these or other factors.
Stacker compiled a list of the fastest-growing cities and counties in Virginia using data from the U.S. Census Bureau. Counties are ranked by the highest population growth from 2010 to 2019, based on 5-year estimates.
A county typically sees population growth as a “bedroom community” (a municipality with an atypically large commuting population) to a large city. These communities are typically quieter than their feeder cities, offer lower rents and a higher quality of living, and are remote enough to be immune to the feeder city’s crime, traffic, and crowds.
Keep reading to see if where you live in Virginia made the list.

#30. Manassas Park
– 2010 to 2019 population change: +3,791
— #605 among all counties nationwide
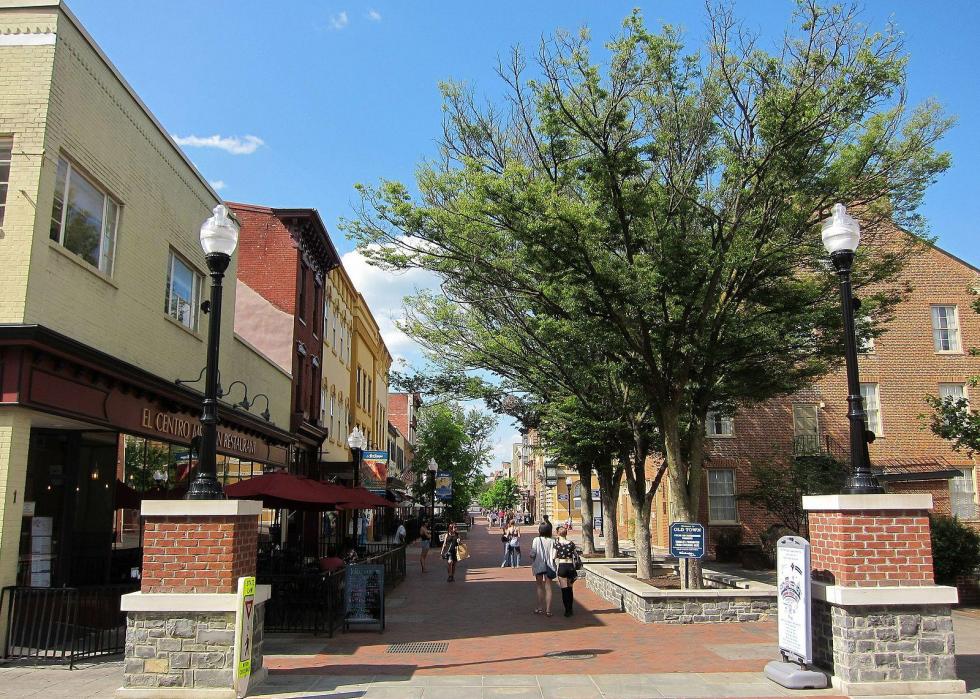
– 2010 to 2019 percent population change: +28.7%
— #2 among counties in Virginia, #38 among all counties nationwide
– 2019 population: 16,986
— #88 largest county in Virginia, #1,980 largest county nationwide

#29. Louisa County
– 2010 to 2019 population change: +3,792
— #604 among all counties nationwide
– 2010 to 2019 percent population change: +11.8%
— #17 among counties in Virginia, #309 among all counties nationwide
– 2019 population: 36,040
— #48 largest county in Virginia, #1,272 largest county nationwide

#28. New Kent County
– 2010 to 2019 population change: +4,031
— #590 among all counties nationwide
– 2010 to 2019 percent population change: +22.8%
— #4 among counties in Virginia, #69 among all counties nationwide
– 2019 population: 21,686
— #80 largest county in Virginia, #1,741 largest county nationwide

#27. Charlottesville
– 2010 to 2019 population change: +4,829
— #551 among all counties nationwide
– 2010 to 2019 percent population change: +11.4%
— #19 among counties in Virginia, #322 among all counties nationwide
– 2019 population: 47,096
— #38 largest county in Virginia, #1,032 largest county nationwide

#26. Manassas
– 2010 to 2019 population change: +5,107
— #537 among all counties nationwide
– 2010 to 2019 percent population change: +14.2%
— #13 among counties in Virginia, #215 among all counties nationwide
– 2019 population: 41,174
— #41 largest county in Virginia, #1,146 largest county nationwide

#25. Fauquier County
– 2010 to 2019 population change: +5,182
— #535 among all counties nationwide
– 2010 to 2019 percent population change: +8.0%
— #34 among counties in Virginia, #535 among all counties nationwide
– 2019 population: 69,728
— #29 largest county in Virginia, #771 largest county nationwide
#24. Fredericksburg
– 2010 to 2019 population change: +5,247
— #530 among all counties nationwide
– 2010 to 2019 percent population change: +22.4%
— #5 among counties in Virginia, #74 among all counties nationwide
– 2019 population: 28,622
— #62 largest county in Virginia, #1,466 largest county nationwide
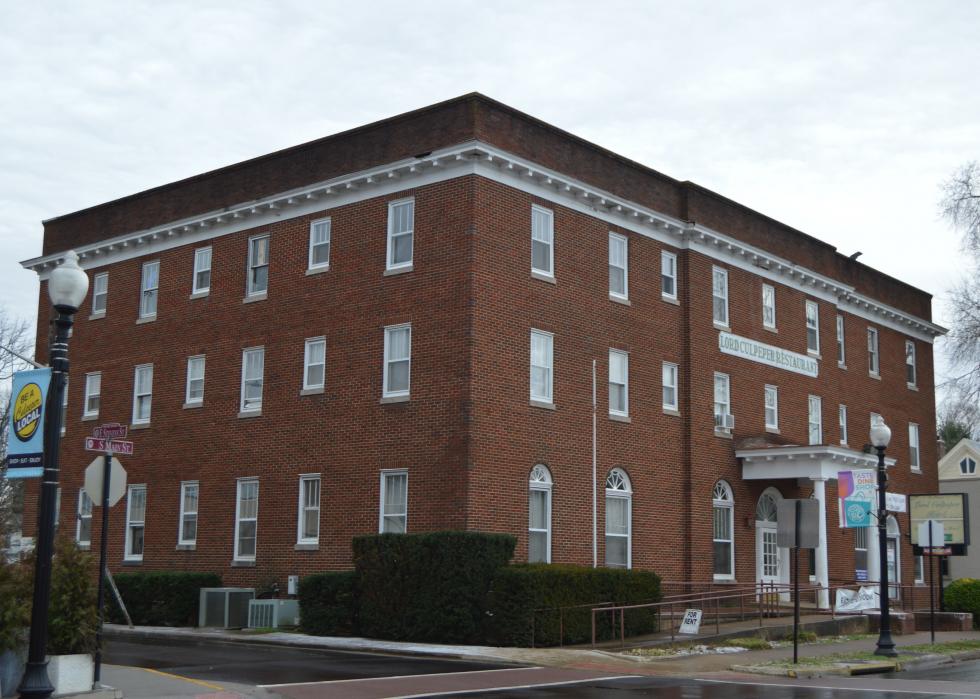
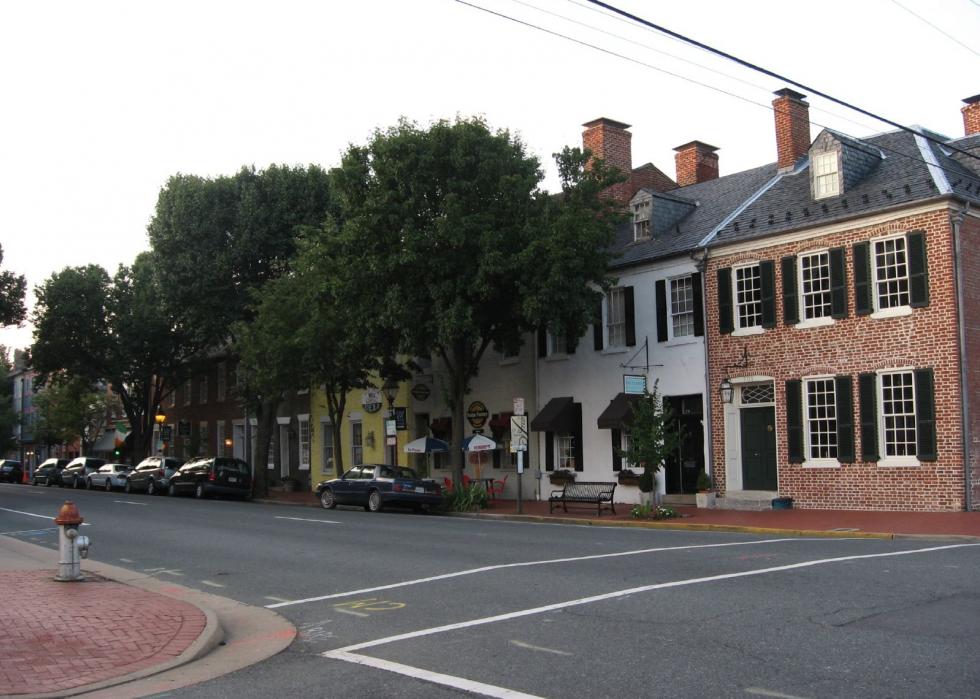
#23. Culpeper County
– 2010 to 2019 population change: +5,352
— #527 among all counties nationwide
– 2010 to 2019 percent population change: +11.7%
— #18 among counties in Virginia, #313 among all counties nationwide
– 2019 population: 51,101
— #37 largest county in Virginia, #975 largest county nationwide

#22. Rockingham County
– 2010 to 2019 population change: +5,362
— #526 among all counties nationwide
– 2010 to 2019 percent population change: +7.2%
— #39 among counties in Virginia, #598 among all counties nationwide
– 2019 population: 80,284
— #25 largest county in Virginia, #701 largest county nationwide

#21. Montgomery County
– 2010 to 2019 population change: +5,613
— #514 among all counties nationwide
– 2010 to 2019 percent population change: +6.1%
— #43 among counties in Virginia, #690 among all counties nationwide
– 2019 population: 98,140
— #19 largest county in Virginia, #605 largest county nationwide
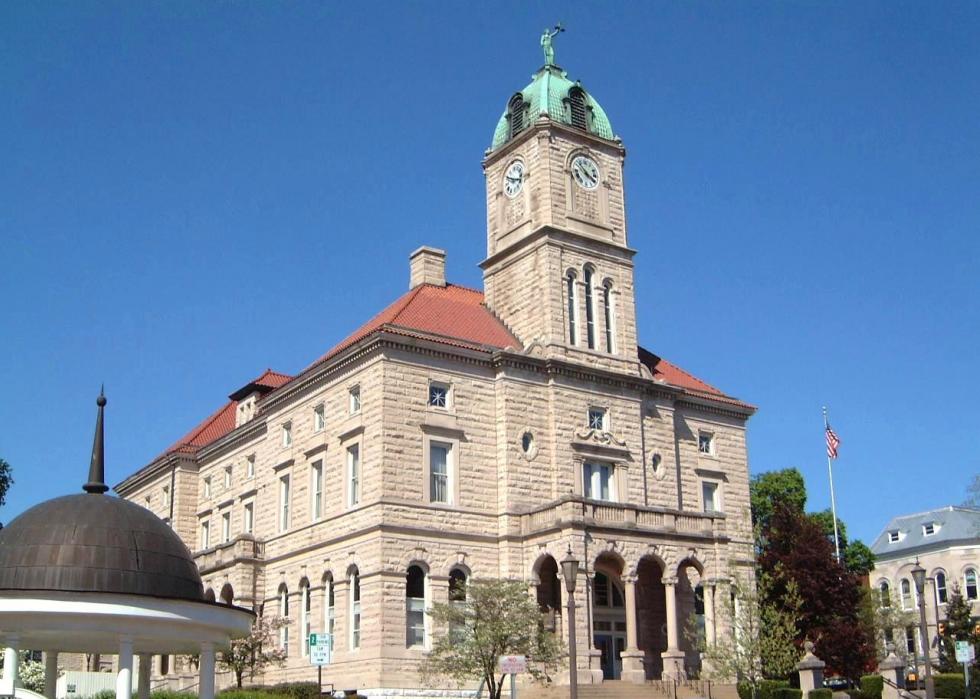
#20. Harrisonburg
– 2010 to 2019 population change: +5,867
— #508 among all counties nationwide
– 2010 to 2019 percent population change: +12.4%
— #15 among counties in Virginia, #279 among all counties nationwide
– 2019 population: 53,273
— #35 largest county in Virginia, #945 largest county nationwide

#19. Hanover County
– 2010 to 2019 population change: +6,365
— #484 among all counties nationwide
– 2010 to 2019 percent population change: +6.4%
— #42 among counties in Virginia, #656 among all counties nationwide
– 2019 population: 105,537
— #17 largest county in Virginia, #567 largest county nationwide

#18. Lynchburg
– 2010 to 2019 population change: +6,843
— #473 among all counties nationwide
– 2010 to 2019 percent population change: +9.3%
— #26 among counties in Virginia, #449 among all counties nationwide
– 2019 population: 80,569
— #24 largest county in Virginia, #698 largest county nationwide

#17. Suffolk
– 2010 to 2019 population change: +7,549
— #456 among all counties nationwide
– 2010 to 2019 percent population change: +9.1%
— #29 among counties in Virginia, #459 among all counties nationwide
– 2019 population: 90,093
— #22 largest county in Virginia, #648 largest county nationwide

#16. James City County
– 2010 to 2019 population change: +10,530
— #380 among all counties nationwide
– 2010 to 2019 percent population change: +16.4%
— #10 among counties in Virginia, #165 among all counties nationwide
– 2019 population: 74,916
— #28 largest county in Virginia, #741 largest county nationwide
#15. Frederick County
– 2010 to 2019 population change: +10,580
— #378 among all counties nationwide
– 2010 to 2019 percent population change: +14.0%
— #14 among counties in Virginia, #222 among all counties nationwide
– 2019 population: 86,415
— #23 largest county in Virginia, #664 largest county nationwide

#14. Bedford County
– 2010 to 2019 population change: +10,679
— #377 among all counties nationwide
– 2010 to 2019 percent population change: +15.8%
— #11 among counties in Virginia, #178 among all counties nationwide
– 2019 population: 78,376
— #26 largest county in Virginia, #711 largest county nationwide

#13. Albemarle County
– 2010 to 2019 population change: +10,772
— #372 among all counties nationwide
– 2010 to 2019 percent population change: +11.1%
— #22 among counties in Virginia, #332 among all counties nationwide
– 2019 population: 107,405
— #16 largest county in Virginia, #561 largest county nationwide

#12. Spotsylvania County
– 2010 to 2019 population change: +12,621
— #346 among all counties nationwide
– 2010 to 2019 percent population change: +10.5%
— #23 among counties in Virginia, #375 among all counties nationwide
– 2019 population: 132,833
— #15 largest county in Virginia, #478 largest county nationwide

#11. Virginia Beach
– 2010 to 2019 population change: +14,205
— #326 among all counties nationwide
– 2010 to 2019 percent population change: +3.3%
— #55 among counties in Virginia, #1,015 among all counties nationwide
– 2019 population: 450,201
— #3 largest county in Virginia, #155 largest county nationwide

#10. Chesapeake
– 2010 to 2019 population change: +20,714
— #259 among all counties nationwide
– 2010 to 2019 percent population change: +9.4%
— #25 among counties in Virginia, #436 among all counties nationwide
– 2019 population: 239,982
— #8 largest county in Virginia, #280 largest county nationwide

#9. Stafford County
– 2010 to 2019 population change: +22,186
— #244 among all counties nationwide
– 2010 to 2019 percent population change: +17.8%
— #9 among counties in Virginia, #135 among all counties nationwide
– 2019 population: 146,773
— #13 largest county in Virginia, #444 largest county nationwide

#8. Alexandria
– 2010 to 2019 population change: +23,966
— #228 among all counties nationwide
– 2010 to 2019 percent population change: +17.9%
— #8 among counties in Virginia, #130 among all counties nationwide
– 2019 population: 157,613
— #12 largest county in Virginia, #417 largest county nationwide

#7. Richmond
– 2010 to 2019 population change: +24,794
— #223 among all counties nationwide
– 2010 to 2019 percent population change: +12.3%
— #16 among counties in Virginia, #282 among all counties nationwide
– 2019 population: 226,622
— #10 largest county in Virginia, #295 largest county nationwide

#6. Henrico County
– 2010 to 2019 population change: +27,482
— #199 among all counties nationwide
– 2010 to 2019 percent population change: +9.2%
— #28 among counties in Virginia, #458 among all counties nationwide
– 2019 population: 327,535
— #6 largest county in Virginia, #211 largest county nationwide

#5. Chesterfield County
– 2010 to 2019 population change: +34,918
— #151 among all counties nationwide
– 2010 to 2019 percent population change: +11.3%
— #20 among counties in Virginia, #327 among all counties nationwide
– 2019 population: 343,551
— #5 largest county in Virginia, #204 largest county nationwide

#4. Arlington County
– 2010 to 2019 population change: +35,997
— #148 among all counties nationwide
– 2010 to 2019 percent population change: +18.2%
— #7 among counties in Virginia, #127 among all counties nationwide
– 2019 population: 233,464
— #9 largest county in Virginia, #282 largest county nationwide

#3. Prince William County
– 2010 to 2019 population change: +82,008
— #58 among all counties nationwide
– 2010 to 2019 percent population change: +21.6%
— #6 among counties in Virginia, #83 among all counties nationwide
– 2019 population: 461,423
— #2 largest county in Virginia, #150 largest county nationwide

#2. Fairfax County
– 2010 to 2019 population change: +97,308
— #46 among all counties nationwide
– 2010 to 2019 percent population change: +9.3%
— #27 among counties in Virginia, #450 among all counties nationwide
– 2019 population: 1,145,862
— #1 largest county in Virginia, #37 largest county nationwide

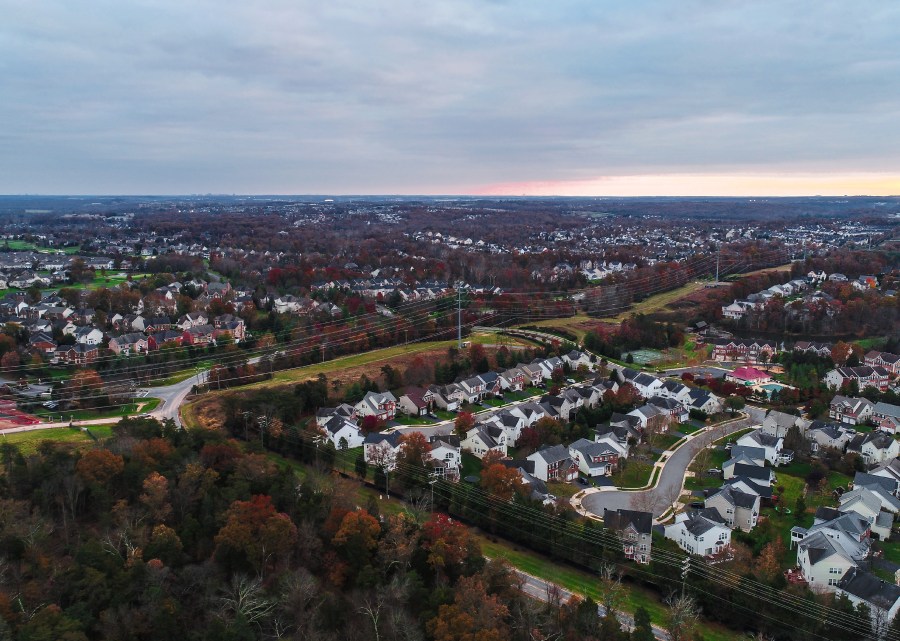
#1. Loudoun County
– 2010 to 2019 population change: +103,481
— #44 among all counties nationwide
– 2010 to 2019 percent population change: +35.5%
— #1 among counties in Virginia, #23 among all counties nationwide
– 2019 population: 395,134
— #4 largest county in Virginia, #176 largest county nationwide