(STACKER) — As has been true throughout America’s COVID-19 history, every state—and every county therein—has its own COVID-19 story, driven by local policies and behaviors.
The United States as of Nov. 9 had reached 756,138 COVID-19-related deaths and 46.6 million COVID-19 cases, according to Johns Hopkins University.
As of Feb. 2, more Americans had been vaccinated for COVID-19 than had been infected. But, as vaccination rates lagged over the summer, new surges of COVID-19 came. More than 80% of these cases by late July were caused by the Delta variant, which is more contagious than the original virus. This has resulted in growing rates of community transmission and—especially in areas with lower vaccination rates—increasing rates of hospitalization and death.
Stacker compiled a list of the counties with highest COVID-19 infection rates in Virginia using data from the U.S. Department of Health & Human Services. Counties are ranked by the highest infection rate per 100k residents within the past week as of Nov. 8, 2021. Cumulative cases per 100k served as a tiebreake.
Keep reading to see if where you live ranks among the highest COVID-19 infection rates in Virginia.

#50. Radford City, VA
- New cases per 100k in the past week: 153 (28 new cases, -12% change from previous week)
- Cumulative cases per 100k: 16,138 (2,945 total cases)
— 47.3% more cases per 100k residents than Virginia - Cumulative deaths per 100k: 181 (33 total deaths)
— 9.0% more deaths per 100k residents than Virginia - Population that is fully vaccinated: 34.5% (6,296 fully vaccinated)
— 45.8% lower vaccination rate than Virginia

#49. Pittsylvania County, VA
- New cases per 100k in the past week: 154 (93 new cases, +6% change from previous week)
- Cumulative cases per 100k: 13,646 (8,236 total cases)
— 24.6% more cases per 100k residents than Virginia - Cumulative deaths per 100k: 200 (121 total deaths)
— 20.5% more deaths per 100k residents than Virginia - Population that is fully vaccinated: 39.2% (23,684 fully vaccinated)
— 38.4% lower vaccination rate than Virginia

#48. Stafford County, VA
- New cases per 100k in the past week: 156 (238 new cases, +34% change from previous week)
- Cumulative cases per 100k: 10,611 (16,222 total cases)
— 3.1% less cases per 100k residents than Virginia - Cumulative deaths per 100k: 70 (107 total deaths)
— 57.8% less deaths per 100k residents than Virginia - Population that is fully vaccinated: 49.6% (75,800 fully vaccinated)
— 22.0% lower vaccination rate than Virginia

#47. Spotsylvania County, VA
- New cases per 100k in the past week: 157 (214 new cases, -22% change from previous week)
- Cumulative cases per 100k: 11,273 (15,356 total cases)
— 2.9% more cases per 100k residents than Virginia - Cumulative deaths per 100k: 112 (152 total deaths)
— 32.5% less deaths per 100k residents than Virginia - Population that is fully vaccinated: 42.3% (57,639 fully vaccinated)
— 33.5% lower vaccination rate than Virginia

#46. King William County, VA
- New cases per 100k in the past week: 157 (27 new cases, +4% change from previous week)
- Cumulative cases per 100k: 11,366 (1,949 total cases)
— 3.8% more cases per 100k residents than Virginia - Cumulative deaths per 100k: 140 (24 total deaths)
— 15.7% less deaths per 100k residents than Virginia - Population that is fully vaccinated: 47.9% (8,221 fully vaccinated)
— 24.7% lower vaccination rate than Virginia

#45. Tazewell County, VA
- New cases per 100k in the past week: 158 (64 new cases, -24% change from previous week)
- Cumulative cases per 100k: 14,236 (5,779 total cases)
— 30.0% more cases per 100k residents than Virginia - Cumulative deaths per 100k: 266 (108 total deaths)
— 60.2% more deaths per 100k residents than Virginia - Population that is fully vaccinated: 38.7% (15,726 fully vaccinated)
— 39.2% lower vaccination rate than Virginia

#44. Giles County, VA
- New cases per 100k in the past week: 161 (27 new cases, -37% change from previous week)
- Cumulative cases per 100k: 13,816 (2,310 total cases)
— 26.1% more cases per 100k residents than Virginia - Cumulative deaths per 100k: 185 (31 total deaths)
— 11.4% more deaths per 100k residents than Virginia - Population that is fully vaccinated: 41.8% (6,990 fully vaccinated)
— 34.3% lower vaccination rate than Virginia

#43. Isle of Wight County, VA
- New cases per 100k in the past week: 164 (61 new cases, +56% change from previous week)
- Cumulative cases per 100k: 12,148 (4,508 total cases)
— 10.9% more cases per 100k residents than Virginia - Cumulative deaths per 100k: 240 (89 total deaths)
— 44.6% more deaths per 100k residents than Virginia - Population that is fully vaccinated: 45.7% (16,960 fully vaccinated)
— 28.1% lower vaccination rate than Virginia

#42. Warren County, VA
- New cases per 100k in the past week: 169 (68 new cases, -34% change from previous week)
- Cumulative cases per 100k: 12,608 (5,064 total cases)
— 15.1% more cases per 100k residents than Virginia - Cumulative deaths per 100k: 217 (87 total deaths)
— 30.7% more deaths per 100k residents than Virginia - Population that is fully vaccinated: 35.5% (14,252 fully vaccinated)
— 44.2% lower vaccination rate than Virginia

#41. Danville city, VA
- New cases per 100k in the past week: 170 (68 new cases, +58% change from previous week)
- Cumulative cases per 100k: 15,693 (6,284 total cases)
— 43.3% more cases per 100k residents than Virginia - Cumulative deaths per 100k: 484 (194 total deaths)
— 191.6% more deaths per 100k residents than Virginia - Population that is fully vaccinated: 33.4% (13,385 fully vaccinated)
— 47.5% lower vaccination rate than Virginia

#40. Poquoson city, VA
- New cases per 100k in the past week: 171 (21 new cases, +110% change from previous week)
- Cumulative cases per 100k: 11,026 (1,353 total cases)
— 0.7% more cases per 100k residents than Virginia - Cumulative deaths per 100k: 179 (22 total deaths)
— 7.8% more deaths per 100k residents than Virginia - Population that is fully vaccinated: 43.5% (5,343 fully vaccinated)
— 31.6% lower vaccination rate than Virginia

#39. Bristol city, VA
- New cases per 100k in the past week: 173 (29 new cases, +38% change from previous week)
- Cumulative cases per 100k: 13,704 (2,297 total cases)
— 25.1% more cases per 100k residents than Virginia - Cumulative deaths per 100k: 286 (48 total deaths)
— 72.3% more deaths per 100k residents than Virginia - Population that is fully vaccinated: 62.0% (10,388 fully vaccinated)
— 2.5% lower vaccination rate than Virginia

#38. Rappahannock County, VA
- New cases per 100k in the past week: 176 (13 new cases, +333% change from previous week)
- Cumulative cases per 100k: 8,005 (590 total cases)
— 26.9% less cases per 100k residents than Virginia - Cumulative deaths per 100k: 68 (5 total deaths)
— 59.0% less deaths per 100k residents than Virginia - Population that is fully vaccinated: 49.5% (3,650 fully vaccinated)
— 22.2% lower vaccination rate than Virginia

#37. Halifax County, VA
- New cases per 100k in the past week: 180 (61 new cases, +11% change from previous week)
- Cumulative cases per 100k: 11,672 (3,958 total cases)
— 6.6% more cases per 100k residents than Virginia - Cumulative deaths per 100k: 318 (108 total deaths)
— 91.6% more deaths per 100k residents than Virginia - Population that is fully vaccinated: 40.6% (13,769 fully vaccinated)
— 36.2% lower vaccination rate than Virginia

#36. Louisa County, VA
- New cases per 100k in the past week: 184 (69 new cases, +33% change from previous week)
- Cumulative cases per 100k: 8,755 (3,291 total cases)
— 20.1% less cases per 100k residents than Virginia - Cumulative deaths per 100k: 130 (49 total deaths)
— 21.7% less deaths per 100k residents than Virginia - Population that is fully vaccinated: 40.5% (15,215 fully vaccinated)
— 36.3% lower vaccination rate than Virginia
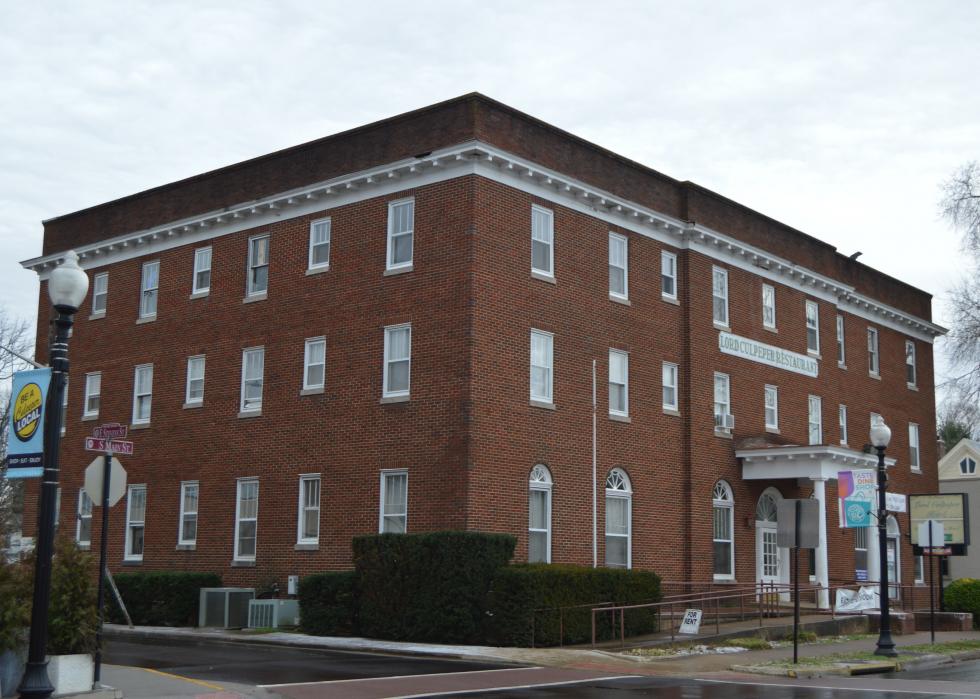
#35. Culpeper County, VA
- New cases per 100k in the past week: 184 (97 new cases, +11% change from previous week)
- Cumulative cases per 100k: 12,529 (6,591 total cases)
— 14.4% more cases per 100k residents than Virginia - Cumulative deaths per 100k: 163 (86 total deaths)
— 1.8% less deaths per 100k residents than Virginia - Population that is fully vaccinated: 43.5% (22,892 fully vaccinated)
— 31.6% lower vaccination rate than Virginia

#34. Waynesboro City, VA
- New cases per 100k in the past week: 186 (42 new cases, +8% change from previous week)
- Cumulative cases per 100k: 16,257 (3,679 total cases)
— 48.4% more cases per 100k residents than Virginia - Cumulative deaths per 100k: 208 (47 total deaths)
— 25.3% more deaths per 100k residents than Virginia - Population that is fully vaccinated: 42.3% (9,581 fully vaccinated)
— 33.5% lower vaccination rate than Virginia

#33. Alleghany County, VA
- New cases per 100k in the past week: 188 (28 new cases, -7% change from previous week)
- Cumulative cases per 100k: 14,482 (2,152 total cases)
— 32.2% more cases per 100k residents than Virginia - Cumulative deaths per 100k: 525 (78 total deaths)
— 216.3% more deaths per 100k residents than Virginia - Population that is fully vaccinated: 37.4% (5,565 fully vaccinated)
— 41.2% lower vaccination rate than Virginia

#32. Botetourt County, VA
- New cases per 100k in the past week: 189 (63 new cases, -29% change from previous week)
- Cumulative cases per 100k: 11,823 (3,951 total cases)
— 7.9% more cases per 100k residents than Virginia - Cumulative deaths per 100k: 159 (53 total deaths)
— 4.2% less deaths per 100k residents than Virginia - Population that is fully vaccinated: 46.5% (15,548 fully vaccinated)
— 26.9% lower vaccination rate than Virginia

#31. Roanoke County, VA
- New cases per 100k in the past week: 189 (178 new cases, -1% change from previous week)
- Cumulative cases per 100k: 12,812 (12,067 total cases)
— 17.0% more cases per 100k residents than Virginia - Cumulative deaths per 100k: 189 (178 total deaths)
— 13.9% more deaths per 100k residents than Virginia - Population that is fully vaccinated: 47.8% (45,029 fully vaccinated)
— 24.8% lower vaccination rate than Virginia

#30. Fluvanna County, VA
- New cases per 100k in the past week: 191 (52 new cases, -32% change from previous week)
- Cumulative cases per 100k: 9,996 (2,726 total cases)
— 8.7% less cases per 100k residents than Virginia - Cumulative deaths per 100k: 88 (24 total deaths)
— 47.0% less deaths per 100k residents than Virginia - Population that is fully vaccinated: 57.3% (15,632 fully vaccinated)
— 9.9% lower vaccination rate than Virginia

#29. Campbell County, VA
- New cases per 100k in the past week: 191 (105 new cases, +14% change from previous week)
- Cumulative cases per 100k: 13,266 (7,281 total cases)
— 21.1% more cases per 100k residents than Virginia - Cumulative deaths per 100k: 257 (141 total deaths)
— 54.8% more deaths per 100k residents than Virginia - Population that is fully vaccinated: 38.4% (21,091 fully vaccinated)
— 39.6% lower vaccination rate than Virginia

#28. King George County, VA
- New cases per 100k in the past week: 201 (54 new cases, +8% change from previous week)
- Cumulative cases per 100k: 10,028 (2,691 total cases)
— 8.4% less cases per 100k residents than Virginia - Cumulative deaths per 100k: 86 (23 total deaths)
— 48.2% less deaths per 100k residents than Virginia - Population that is fully vaccinated: 43.5% (11,677 fully vaccinated)
— 31.6% lower vaccination rate than Virginia

#27. Dickenson County, VA
- New cases per 100k in the past week: 203 (29 new cases, -49% change from previous week)
- Cumulative cases per 100k: 11,817 (1,692 total cases)
— 7.9% more cases per 100k residents than Virginia - Cumulative deaths per 100k: 196 (28 total deaths)
— 18.1% more deaths per 100k residents than Virginia - Population that is fully vaccinated: 42.4% (6,067 fully vaccinated)
— 33.3% lower vaccination rate than Virginia

#26. Caroline County, VA
- New cases per 100k in the past week: 208 (64 new cases, -11% change from previous week)
- Cumulative cases per 100k: 13,019 (4,000 total cases)
— 18.9% more cases per 100k residents than Virginia - Cumulative deaths per 100k: 169 (52 total deaths)
— 1.8% more deaths per 100k residents than Virginia - Population that is fully vaccinated: 38.0% (11,664 fully vaccinated)
— 40.3% lower vaccination rate than Virginia

#25. Franklin City, VA
- New cases per 100k in the past week: 213 (17 new cases, -6% change from previous week)
- Cumulative cases per 100k: 20,585 (1,640 total cases)
— 87.9% more cases per 100k residents than Virginia - Cumulative deaths per 100k: 552 (44 total deaths)
— 232.5% more deaths per 100k residents than Virginia - Population that is fully vaccinated: 36.7% (2,921 fully vaccinated)
— 42.3% lower vaccination rate than Virginia

#24. Lexington City, VA
- New cases per 100k in the past week: 215 (16 new cases, -11% change from previous week)
- Cumulative cases per 100k: 21,327 (1,588 total cases)
— 94.7% more cases per 100k residents than Virginia - Cumulative deaths per 100k: 483 (36 total deaths)
— 191.0% more deaths per 100k residents than Virginia - Population that is fully vaccinated: 38.9% (2,897 fully vaccinated)
— 38.8% lower vaccination rate than Virginia

#23. Smyth County, VA
- New cases per 100k in the past week: 219 (66 new cases, -42% change from previous week)
- Cumulative cases per 100k: 16,466 (4,957 total cases)
— 50.3% more cases per 100k residents than Virginia - Cumulative deaths per 100k: 395 (119 total deaths)
— 138.0% more deaths per 100k residents than Virginia - Population that is fully vaccinated: 44.3% (13,323 fully vaccinated)
— 30.3% lower vaccination rate than Virginia

#22. Washington County, VA
- New cases per 100k in the past week: 221 (119 new cases, +19% change from previous week)
- Cumulative cases per 100k: 14,343 (7,708 total cases)
— 31.0% more cases per 100k residents than Virginia - Cumulative deaths per 100k: 275 (148 total deaths)
— 65.7% more deaths per 100k residents than Virginia - Population that is fully vaccinated: 52.7% (28,338 fully vaccinated)
— 17.1% lower vaccination rate than Virginia

#21. Henry County, VA
- New cases per 100k in the past week: 227 (115 new cases, -12% change from previous week)
- Cumulative cases per 100k: 13,066 (6,606 total cases)
— 19.3% more cases per 100k residents than Virginia - Cumulative deaths per 100k: 322 (163 total deaths)
— 94.0% more deaths per 100k residents than Virginia - Population that is fully vaccinated: 37.3% (18,852 fully vaccinated)
— 41.4% lower vaccination rate than Virginia

#20. Shenandoah County, VA
- New cases per 100k in the past week: 229 (100 new cases, -1% change from previous week)
- Cumulative cases per 100k: 14,974 (6,531 total cases)
— 36.7% more cases per 100k residents than Virginia - Cumulative deaths per 100k: 369 (161 total deaths)
— 122.3% more deaths per 100k residents than Virginia - Population that is fully vaccinated: 45.4% (19,804 fully vaccinated)
— 28.6% lower vaccination rate than Virginia

#19. Amelia County, VA
- New cases per 100k in the past week: 236 (31 new cases, +19% change from previous week)
- Cumulative cases per 100k: 11,084 (1,457 total cases)
— 1.2% more cases per 100k residents than Virginia - Cumulative deaths per 100k: 304 (40 total deaths)
— 83.1% more deaths per 100k residents than Virginia - Population that is fully vaccinated: 33.7% (4,424 fully vaccinated)
— 47.0% lower vaccination rate than Virginia

#18. Greensville County, VA
- New cases per 100k in the past week: 238 (27 new cases, +125% change from previous week)
- Cumulative cases per 100k: 16,920 (1,918 total cases)
— 54.5% more cases per 100k residents than Virginia - Cumulative deaths per 100k: 229 (26 total deaths)
— 38.0% more deaths per 100k residents than Virginia - Population that is fully vaccinated: 34.1% (3,868 fully vaccinated)
— 46.4% lower vaccination rate than Virginia

#17. Prince George County, VA
- New cases per 100k in the past week: 245 (94 new cases, +114% change from previous week)
- Cumulative cases per 100k: 13,185 (5,057 total cases)
— 20.4% more cases per 100k residents than Virginia - Cumulative deaths per 100k: 120 (46 total deaths)
— 27.7% less deaths per 100k residents than Virginia - Population that is fully vaccinated: 54.7% (20,997 fully vaccinated)
— 14.0% lower vaccination rate than Virginia

#16. Dinwiddie County, VA
- New cases per 100k in the past week: 249 (71 new cases, +82% change from previous week)
- Cumulative cases per 100k: 11,270 (3,217 total cases)
— 2.9% more cases per 100k residents than Virginia - Cumulative deaths per 100k: 182 (52 total deaths)
— 9.6% more deaths per 100k residents than Virginia - Population that is fully vaccinated: 44.3% (12,652 fully vaccinated)
— 30.3% lower vaccination rate than Virginia

#15. Craig County, VA
- New cases per 100k in the past week: 253 (13 new cases, +62% change from previous week)
- Cumulative cases per 100k: 10,914 (560 total cases)
— 0.4% less cases per 100k residents than Virginia - Cumulative deaths per 100k: 156 (8 total deaths)
— 6.0% less deaths per 100k residents than Virginia - Population that is fully vaccinated: 31.9% (1,635 fully vaccinated)
— 49.8% lower vaccination rate than Virginia

#14. Wythe County, VA
- New cases per 100k in the past week: 258 (74 new cases, -10% change from previous week)
- Cumulative cases per 100k: 15,946 (4,574 total cases)
— 45.6% more cases per 100k residents than Virginia - Cumulative deaths per 100k: 356 (102 total deaths)
— 114.5% more deaths per 100k residents than Virginia - Population that is fully vaccinated: 35.9% (10,289 fully vaccinated)
— 43.6% lower vaccination rate than Virginia

#13. Martinsville City, VA
- New cases per 100k in the past week: 271 (34 new cases, 0% change from previous week)
- Cumulative cases per 100k: 16,672 (2,093 total cases)
— 52.2% more cases per 100k residents than Virginia - Cumulative deaths per 100k: 725 (91 total deaths)
— 336.7% more deaths per 100k residents than Virginia - Population that is fully vaccinated: 39.1% (4,908 fully vaccinated)
— 38.5% lower vaccination rate than Virginia

#12. Patrick County, VA
- New cases per 100k in the past week: 278 (49 new cases, +11% change from previous week)
- Cumulative cases per 100k: 11,887 (2,093 total cases)
— 8.5% more cases per 100k residents than Virginia - Cumulative deaths per 100k: 312 (55 total deaths)
— 88.0% more deaths per 100k residents than Virginia - Population that is fully vaccinated: 37.0% (6,508 fully vaccinated)
— 41.8% lower vaccination rate than Virginia

#11. Buena Vista City, VA
- New cases per 100k in the past week: 278 (18 new cases, -54% change from previous week)
- Cumulative cases per 100k: 20,670 (1,339 total cases)
— 88.7% more cases per 100k residents than Virginia - Cumulative deaths per 100k: 417 (27 total deaths)
— 151.2% more deaths per 100k residents than Virginia - Population that is fully vaccinated: 36.8% (2,384 fully vaccinated)
— 42.1% lower vaccination rate than Virginia

#10. Falls Church City, VA
- New cases per 100k in the past week: 301 (44 new cases, +2,100% change from previous week)
- Cumulative cases per 100k: 4,030 (589 total cases)
— 63.2% less cases per 100k residents than Virginia - Cumulative deaths per 100k: 75 (11 total deaths)
— 54.8% less deaths per 100k residents than Virginia - Population that is fully vaccinated: 54.4% (7,956 fully vaccinated)
— 14.5% lower vaccination rate than Virginia
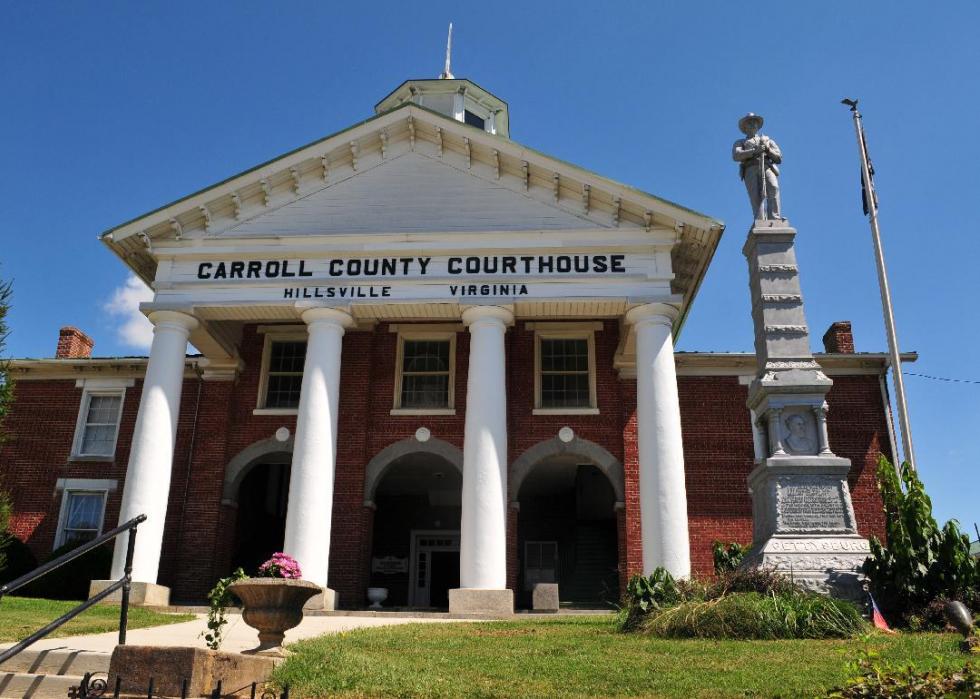
#9. Carroll County, VA
- New cases per 100k in the past week: 302 (90 new cases, +45% change from previous week)
- Cumulative cases per 100k: 13,548 (4,036 total cases)
— 23.7% more cases per 100k residents than Virginia - Cumulative deaths per 100k: 322 (96 total deaths)
— 94.0% more deaths per 100k residents than Virginia - Population that is fully vaccinated: 31.5% (9,382 fully vaccinated)
— 50.5% lower vaccination rate than Virginia

#8. Grayson County, VA
- New cases per 100k in the past week: 302 (47 new cases, +96% change from previous week)
- Cumulative cases per 100k: 13,653 (2,123 total cases)
— 24.7% more cases per 100k residents than Virginia - Cumulative deaths per 100k: 296 (46 total deaths)
— 78.3% more deaths per 100k residents than Virginia - Population that is fully vaccinated: 38.3% (5,962 fully vaccinated)
— 39.8% lower vaccination rate than Virginia

#7. Scott County, VA
- New cases per 100k in the past week: 306 (66 new cases, +25% change from previous week)
- Cumulative cases per 100k: 14,917 (3,217 total cases)
— 36.2% more cases per 100k residents than Virginia - Cumulative deaths per 100k: 362 (78 total deaths)
— 118.1% more deaths per 100k residents than Virginia - Population that is fully vaccinated: 51.4% (11,094 fully vaccinated)
— 19.2% lower vaccination rate than Virginia

#6. Galax City, VA
- New cases per 100k in the past week: 315 (20 new cases, -13% change from previous week)
- Cumulative cases per 100k: 24,311 (1,543 total cases)
— 122.0% more cases per 100k residents than Virginia - Cumulative deaths per 100k: 977 (62 total deaths)
— 488.6% more deaths per 100k residents than Virginia - Population that is fully vaccinated: 37.0% (2,349 fully vaccinated)
— 41.8% lower vaccination rate than Virginia

#5. Wise County, VA
- New cases per 100k in the past week: 326 (122 new cases, -22% change from previous week)
- Cumulative cases per 100k: 14,646 (5,475 total cases)
— 33.7% more cases per 100k residents than Virginia - Cumulative deaths per 100k: 345 (129 total deaths)
— 107.8% more deaths per 100k residents than Virginia - Population that is fully vaccinated: 42.0% (15,716 fully vaccinated)
— 34.0% lower vaccination rate than Virginia

#4. Bland County, VA
- New cases per 100k in the past week: 430 (27 new cases, +108% change from previous week)
- Cumulative cases per 100k: 17,420 (1,094 total cases)
— 59.0% more cases per 100k residents than Virginia - Cumulative deaths per 100k: 271 (17 total deaths)
— 63.3% more deaths per 100k residents than Virginia - Population that is fully vaccinated: 35.2% (2,212 fully vaccinated)
— 44.7% lower vaccination rate than Virginia
#3. Fairfax City, VA
- New cases per 100k in the past week: 462 (111 new cases, +2,675% change from previous week)
- Cumulative cases per 100k: 3,181 (764 total cases)
— 71.0% less cases per 100k residents than Virginia - Cumulative deaths per 100k: 112 (27 total deaths)
— 32.5% less deaths per 100k residents than Virginia - Population that is fully vaccinated: 56.1% (13,481 fully vaccinated)
— 11.8% lower vaccination rate than Virginia

#2. Buchanan County, VA
- New cases per 100k in the past week: 528 (111 new cases, +79% change from previous week)
- Cumulative cases per 100k: 12,093 (2,540 total cases)
— 10.4% more cases per 100k residents than Virginia - Cumulative deaths per 100k: 309 (65 total deaths)
— 86.1% more deaths per 100k residents than Virginia - Population that is fully vaccinated: 43.9% (9,216 fully vaccinated)
— 31.0% lower vaccination rate than Virginia

#1. Norton City, VA
- New cases per 100k in the past week: 528 (21 new cases, +62% change from previous week)
- Cumulative cases per 100k: 14,921 (594 total cases)
— 36.2% more cases per 100k residents than Virginia - Cumulative deaths per 100k: 352 (14 total deaths)
— 112.0% more deaths per 100k residents than Virginia - Population that is fully vaccinated: 31.0% (1,233 fully vaccinated)
— 51.3% lower vaccination rate than Virginia